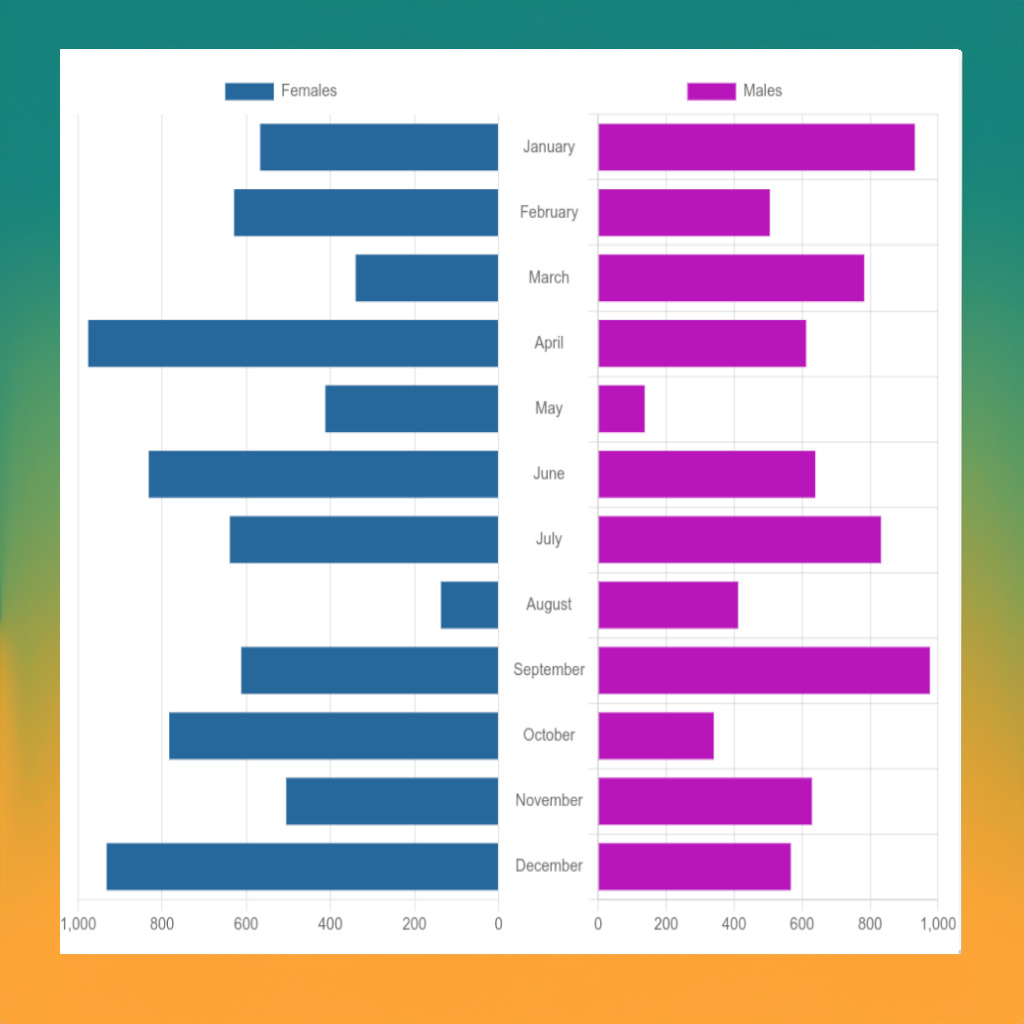
Compare diverse datasets easily, make informed decisions, and engage your audience with striking, easy-to-understand visuals. Ideal for business, academic, or personal use.
|
|
|
|
|
|
Did you love the function? Bookmark This Page for easy access next time.
Our ‘Side by Side Comparison Bar Chart’ service helps you show two sets of data next to each other. You can use this to compare things easily. For example, if you want to show how many boys and girls are in each month of the year, or how many products you sold this year compared to last year, this tool can help.
You just need to put your data into the tool, and it will make two bar charts for you. These charts will be next to each other, so you can see the differences between the two sets of data clearly. This tool is good for anyone who needs to compare two sets of numbers or amounts. It’s easy to use and understand, so you can start comparing your data right away

