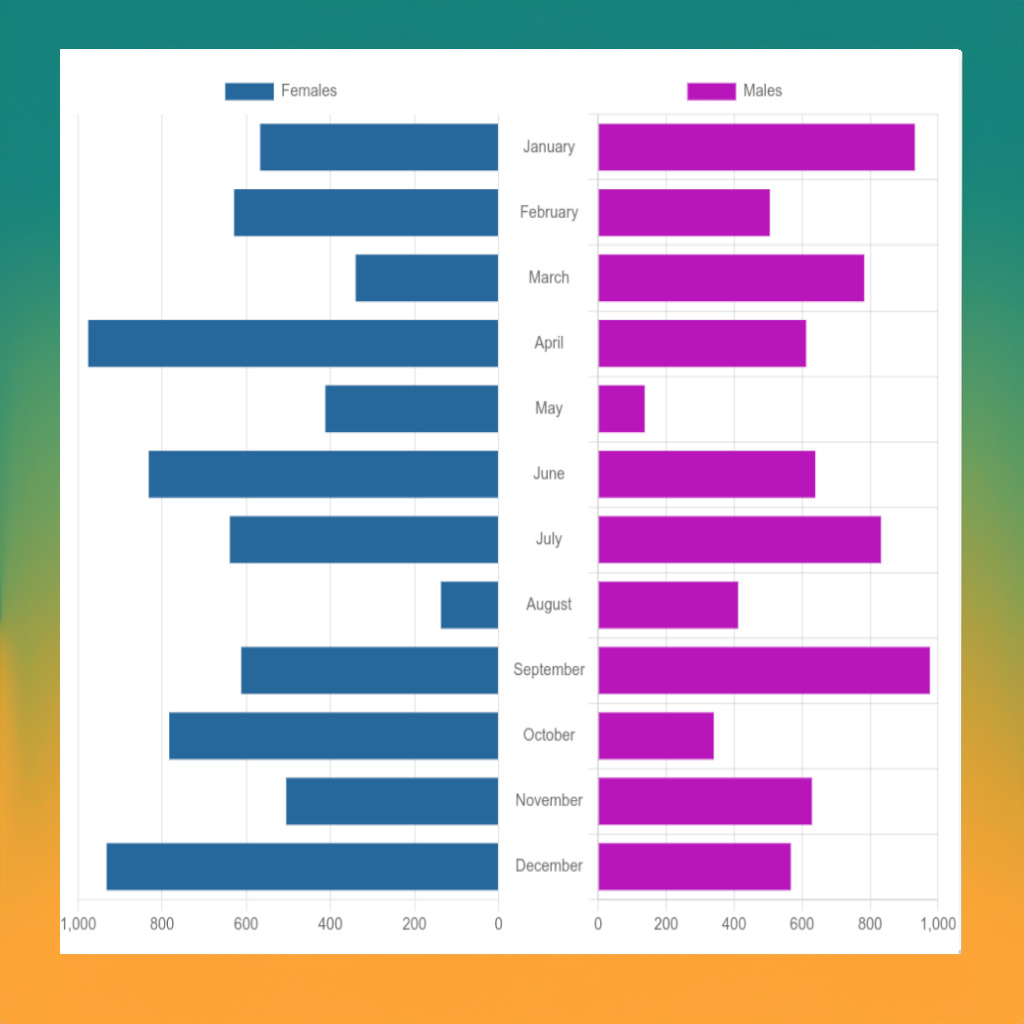
The “CSV to Chart” tool is an instant solution that transforms CSV data into visual charts. The tool allows users to select a CSV file, choose the columns for the X and Y axes, and instantly generate an interactive chart. Ideal for data visualization, data analysis, reporting, or presentations, this tool simplifies the process of turning raw CSV data into meaningful visuals. If you want to transform your raw data into interactive chart, use this “Text List to Chart” service.
Did you love the function? Bookmark This Page for easy access next time.

Through this simple yet powerful tool, you can extract meaning from raw CSV data, transform data lists into insightful charts, and create data-driven reports and presentations with ease. Ideal for students, educators, data analysts, and businesses, our “CSV to Chart” tool serves as a go-to solution for quick, convenient, and efficient data visualization.
Step-by-step Explanation:
- Choose a CSV file: The first step in using our tool is selecting the CSV file you wish to visualize. This can be any CSV file saved on your computer.
- Parse CSV file: Upon selection, the tool automatically parses the CSV file. This involves reading the file, understanding its structure, and extracting the column names. The extraction process is efficient, saving you the effort of manually identifying and inputting data.
- Select Columns: Post parsing, the tool displays two select boxes containing the names of the columns found in the CSV file. These boxes represent the X and Y axes of the chart you’re about to create. Choose the column you want to represent on the X axis from the first box and the column for the Y axis from the second box.
- Generate Chart: Once the columns are selected, our tool instantly generates an interactive chart based on the chosen X and Y axis data. This chart is not only visually appealing but also responsive, offering insights into the data with the simple hover of a cursor.
- Interactive Chart: Enjoy the results of the tool, explore your data visually and gain new insights. The chart generated is interactive, making data analysis and data exploration a breeze.
Converting XLSX to CSV: A Simple Guide
Do you have data in XLSX format and need it in CSV for our Chart Converter? Don’t worry, converting an XLSX file to CSV is straightforward. Here’s how you can do it with Excel and Google Sheets:
In Microsoft Excel:
- Open your XLSX file in Microsoft Excel.
- Click on the ‘File’ tab on the upper left corner.
- From the dropdown menu, select ‘Save As.’
- A dialog box will appear, prompting you to select the location to save the file. Choose your preferred location.
- In the ‘Save as type’ dropdown menu, select ‘CSV (Comma delimited) (*.csv)’.
- Click ‘Save.’ You may get a prompt that your file may contain features not compatible with CSV, click ‘Yes’ to proceed. Your file will be saved as a CSV.
In Google Sheets:
- Open Google Sheets and upload your XLSX file.
- Once the file is open, click on ‘File’ on the menu.
- From the dropdown, select ‘Download.’
- Then choose ‘Comma-separated values (.csv, current sheet).’
- The file will automatically download as a CSV file.
Remember, while converting to CSV, some formatting might not be retained due to the simplicity of CSV file structure. Now, you are ready to create charts using our CSV to Chart Converter service. Happy charting!
You may want to try these instant chart/graph builders:
 |
|
 |
|
 |
|
 |

