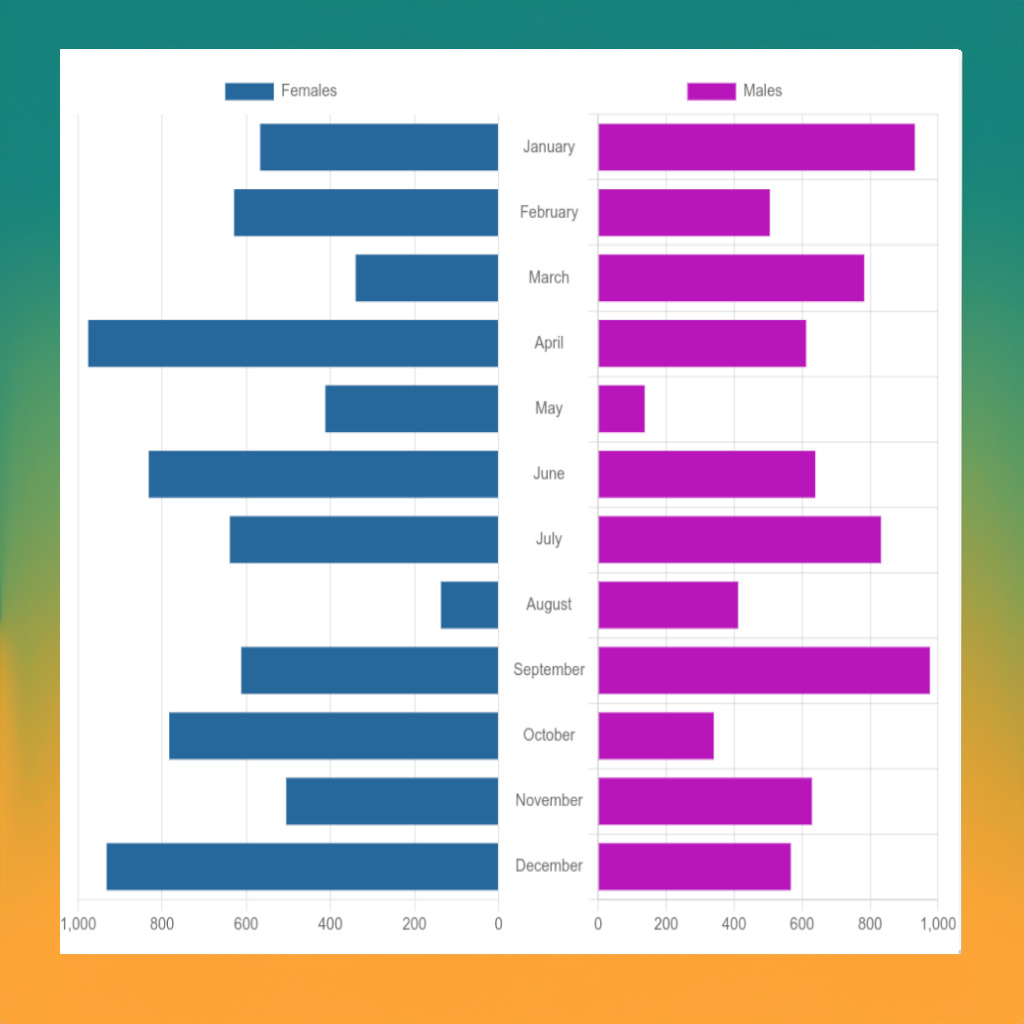
A service which simply turns your text inputs to graphic charts – simple pie chart creator, simple bar chart creator, simple bar chart creator – 3 in 1.
|
|
|
|
|
|
Chart will appear here
Did you love the function? Bookmark This Page for easy access next time.
Transform your raw data into interactive charts with this instant list-to-chart generator. Ideal for users who prefer simplicity and efficiency, our tool allows you to create pie, bar, and line charts just by entering your list data.
Our “List to Chart” service is a reliable tool for converting raw data into interactive, easy-to-understand charts. Ideal for data analysis, reporting, or presentation purposes, this tool takes simple data lists and instantly generates pie charts, bar charts, or line charts.
The process is as straightforward as inputting data into the X and Y axes fields and choosing the desired chart type. This eliminates the need for complex data visualization software or advanced technical knowledge, making it a go-to solution for data visualization beginners or those seeking a quick and efficient method.
The feature to download the generated chart adds to its utility, offering flexibility for offline use or integration into reports and presentations.
By leveraging the convenience of our “List to Chart” service, users can spend less time wrestling with data and more time gleaning insights and sharing their findings. Numbers to chart, numbers to graph are easy with this tool.
You may want to try these instant chart/graph builders:
 |
|
 |
|
 |
|
 |

